
rENA draws plots with one of two backends. plotly is the default. qeviz (>= 0.5.0, from https://cran.qe-libs.org; a suggested package) draws the same plots with qeviz, the library behind webENA's network plots, and returns a qeviz htmlwidget.
Choosing a backend
Per plot, with ena.plot(set, backend = "qeviz"), or for the session
with options(rENA.plot.backend = "qeviz"). ena.plotter
and ena.plot.subtraction take backend too and pass it
to every plot they create.
Existing plotting code works unchanged on either backend:
ena.plot.network, ena.plot.points,
ena.plot.group, and the pipe API (add_network(),
add_points(), add_group(), with_means(),
check_range(), show()) add layers to whichever backend the
plot was created with.
Side by side
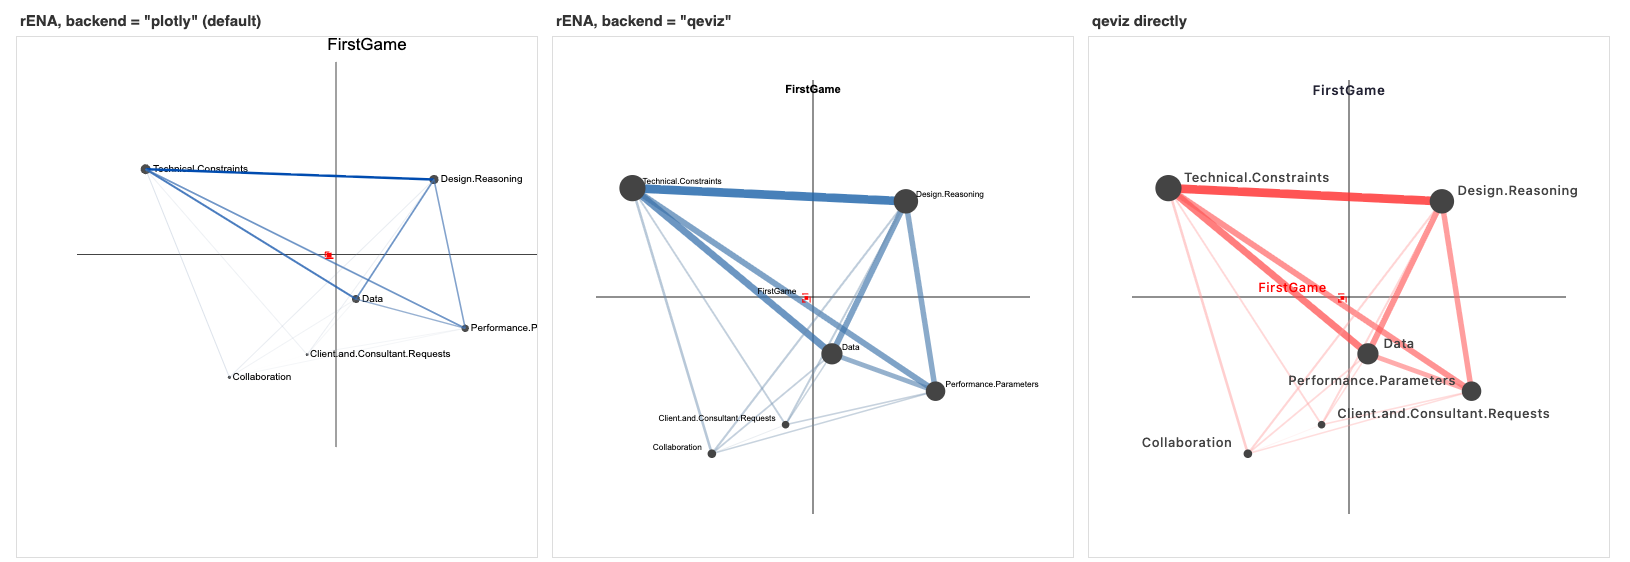
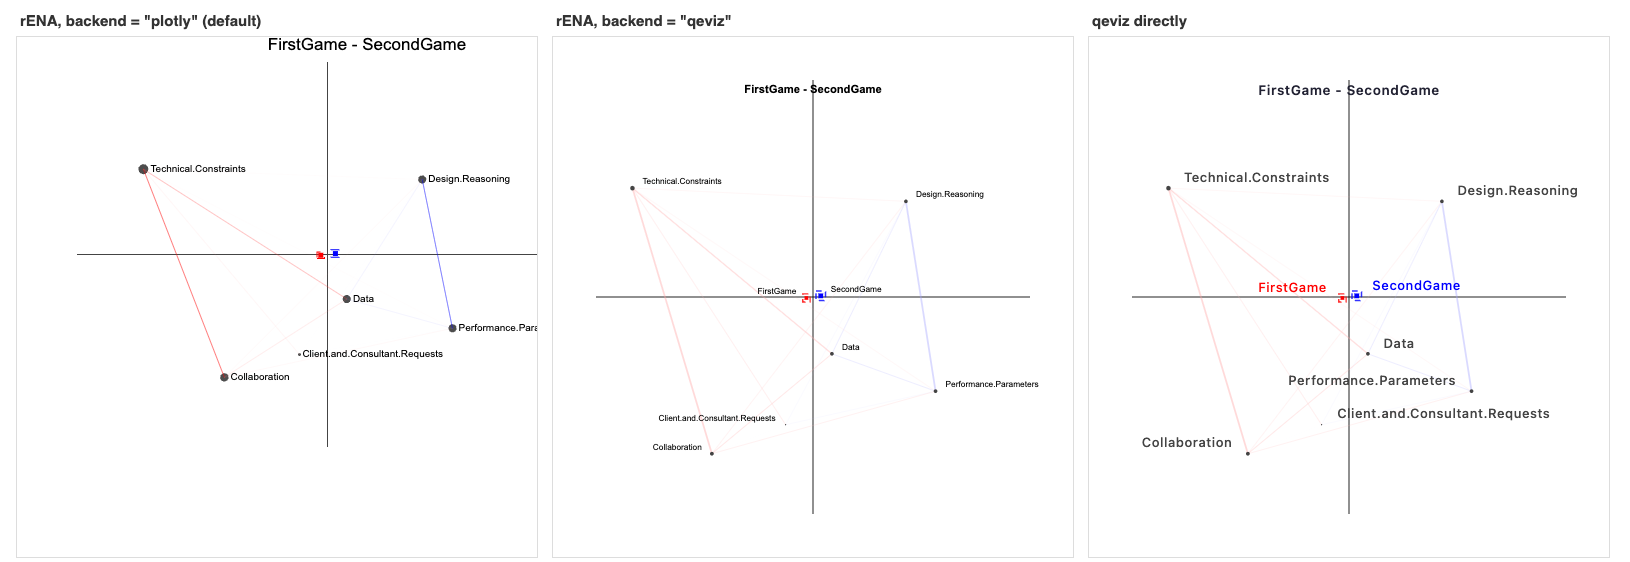
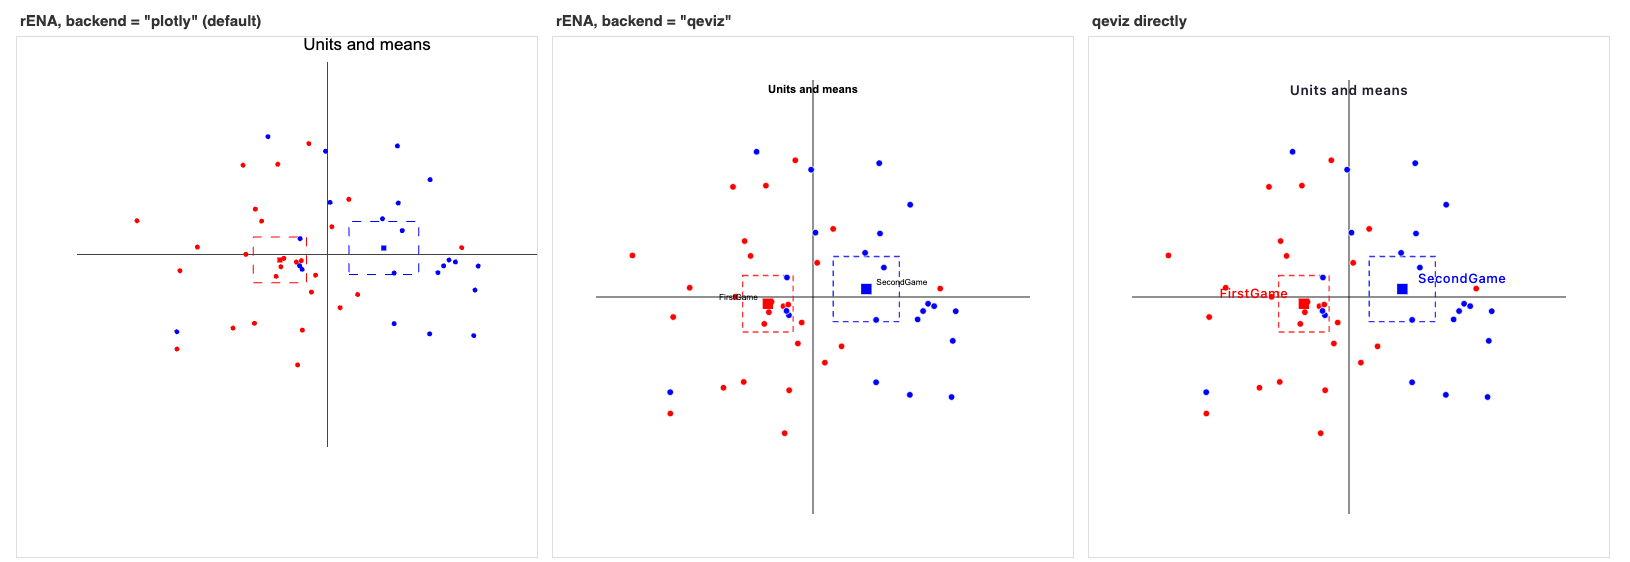
The same rENA code on RS.data drawn with each backend (left and middle),
and the same view written with qeviz's own functions (right). The code for
every panel is in PLOT-BACKENDS.md in the package sources, also at
https://qe-libs.org/cran/pkg/rENA/PLOT-BACKENDS.html.
One group's mean network and its mean, from ena.plot.network() and
ena.plot.group(). On qeviz, line width is absolute per weight and
each node's size is the sum of its edge widths:
A subtraction, FirstGame - SecondGame, with both means. Colour and width
are on the model-wide scale, so the small differences in a subtraction draw
lighter than a group's network; multiplier (or
ena.plotter()'s multipliers) magnifies them:
Every unit and both means with scale.to = "points", from
ena.plot.points() and ena.plot.group():
What differs on qeviz
$plotis a qeviz htmlwidget, not a plotly object, so code that edits it withplotly::layout()or other plotly functions does not apply.print()shows it as before.Scaling. Line width is absolute per weight, colour intensity is scaled across the whole model, and a node's size is the sum of its edge widths. Separate plots of one model are therefore directly comparable.
thickness,opacity,saturation,scale.range,scale.weightsandnode.sizeare ignored.Multipliers.
ena.plot(multiplier =),add_network(edge.multiplier =), and theena.plotter()andena.plot.subtraction()multipliers magnify the drawn network rather than multiplying the weights.ena.plotter()andena.plot.subtraction()label their plots "(scaled Nx)".Point size.
point.sizeis halved to match qeviz's units, so the default sizes look the same.Means. Each
ena.plot.group()call keeps its own confidence and outlier intervals. An outlier interval drawn as"crosshairs"is drawn as a box.methodmust be"mean".Ranges are symmetric:
scale.tois"network","points"or a number;list(x =, y =)is an error.Default palette is Paul Tol's "bright" (
qeviz::qe_palette()). Colours you pass are used as given.
Not available on qeviz
Trajectories and movies (ena.plot.trajectory,
add_trajectory(), ena.plot.movie,
with_trajectory()) warn with class rENA_qeviz_unsupported
and return the plot unchanged; use backend = "plotly" for them.
Dashed or dotted edges, label offsets, legends and per-point confidence or
outlier intervals are not drawn.
Arguments that would change the picture but cannot be honoured warn once
per session. Plotly-only layout options (showticklabels,
ticks, axispadding, autosize, automargin,
displayModeBar) are ignored without a warning.
Examples
if (requireNamespace("qeviz", quietly = TRUE) &&
    utils::packageVersion("qeviz") >= "0.5.0") {
  data(RS.data)
  codeNames <- c("Data", "Technical.Constraints", "Performance.Parameters",
    "Client.and.Consultant.Requests", "Design.Reasoning", "Collaboration")
  accum <- ena.accumulate.data(
    units = RS.data[, c("Condition", "UserName")],
    conversation = RS.data[, c("Condition", "GroupName")],
    codes = RS.data[, codeNames],
    window.size.back = 4
  )
  set <- ena.make.set(accum)
  first <- set$meta.data$Condition == "FirstGame"

  plot <- ena.plot(set, title = "FirstGame", backend = "qeviz")
  plot <- ena.plot.network(plot, network = colMeans(as.matrix(set$line.weights[first, ])))
  plot <- ena.plot.group(plot, as.matrix(set$points[first, ]), labels = "FirstGame",
                         confidence.interval = "box")
  print(plot)
}